Server network calls
Every fetch, axios, got or node-fetch call made on the server, with headers, bodies, status, timing and the file:line that made it.
The Next.js debugging tool that sees every request, log and line your app runs.
Server and browser network calls, server and browser logs, and breakpoints in Server and Client Components, in one inspector. No SDK, no config, no code changes.
npm install -g qaisdebugs
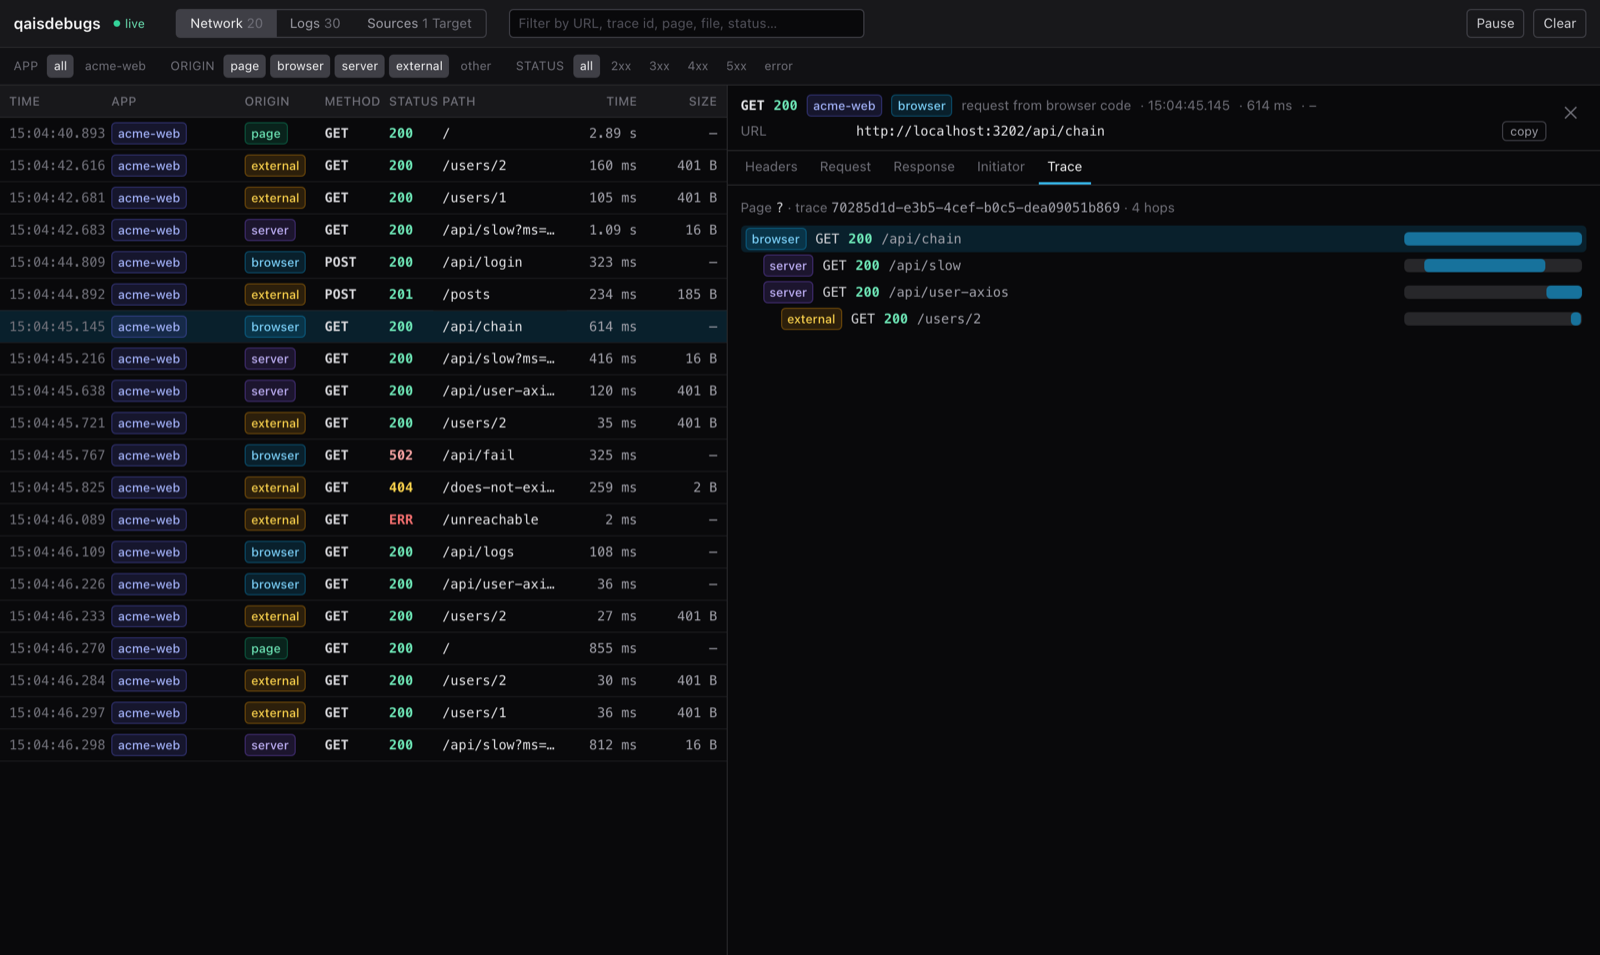
In a Next.js app most of the interesting traffic never reaches the browser: Server Components calling your backend, Route Handlers calling third-party APIs, Server Actions and axios running on the server.
console.log lines in a terminal--inspect by handEvery fetch, axios, got or node-fetch call made on the server, with headers, bodies, status, timing and the file:line that made it.
Every request the page makes, in any browser, merged with the server's view of the same call into one row.
Each page load is a tree: the browser's request, the server calling itself, and the calls out to external APIs.
Server and browser console.* output and uncaught errors in one list, each with its file, line and request.
Pause Server Components, Route Handlers, Server Actions and 'use client' code. Step, read scopes, evaluate.
Passwords, tokens, API keys, auth headers and cookies are masked before anything is recorded.
Attaches from outside with a Node preload. Your code, config and dependencies stay exactly as they are.
An MCP server lets Claude read the requests and logs and set breakpoints in your app itself.
/api/chain calling the server twice and an external API once.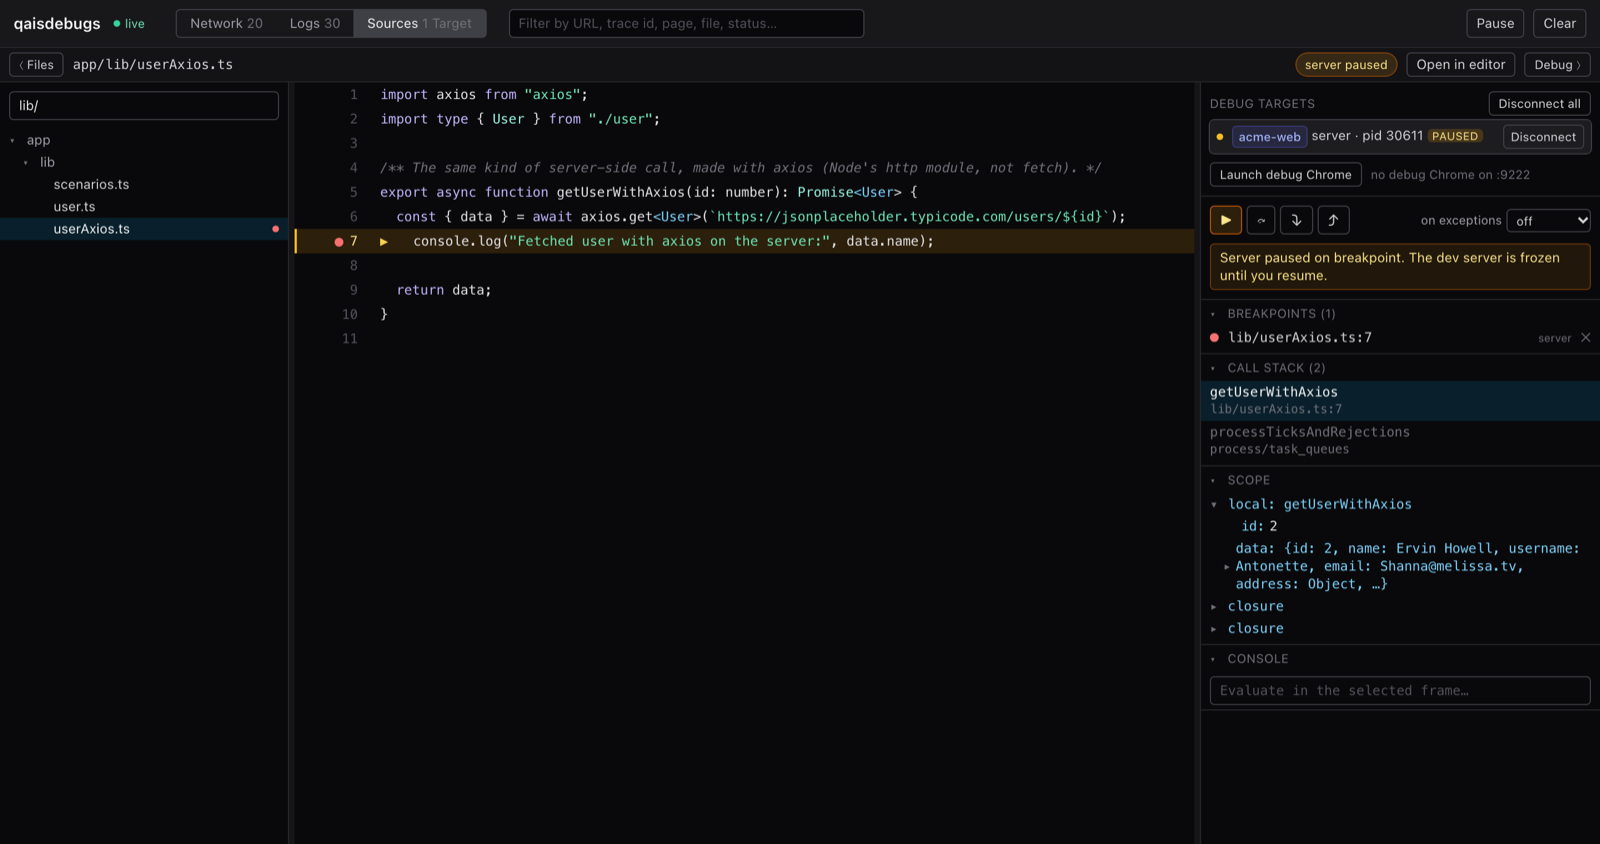
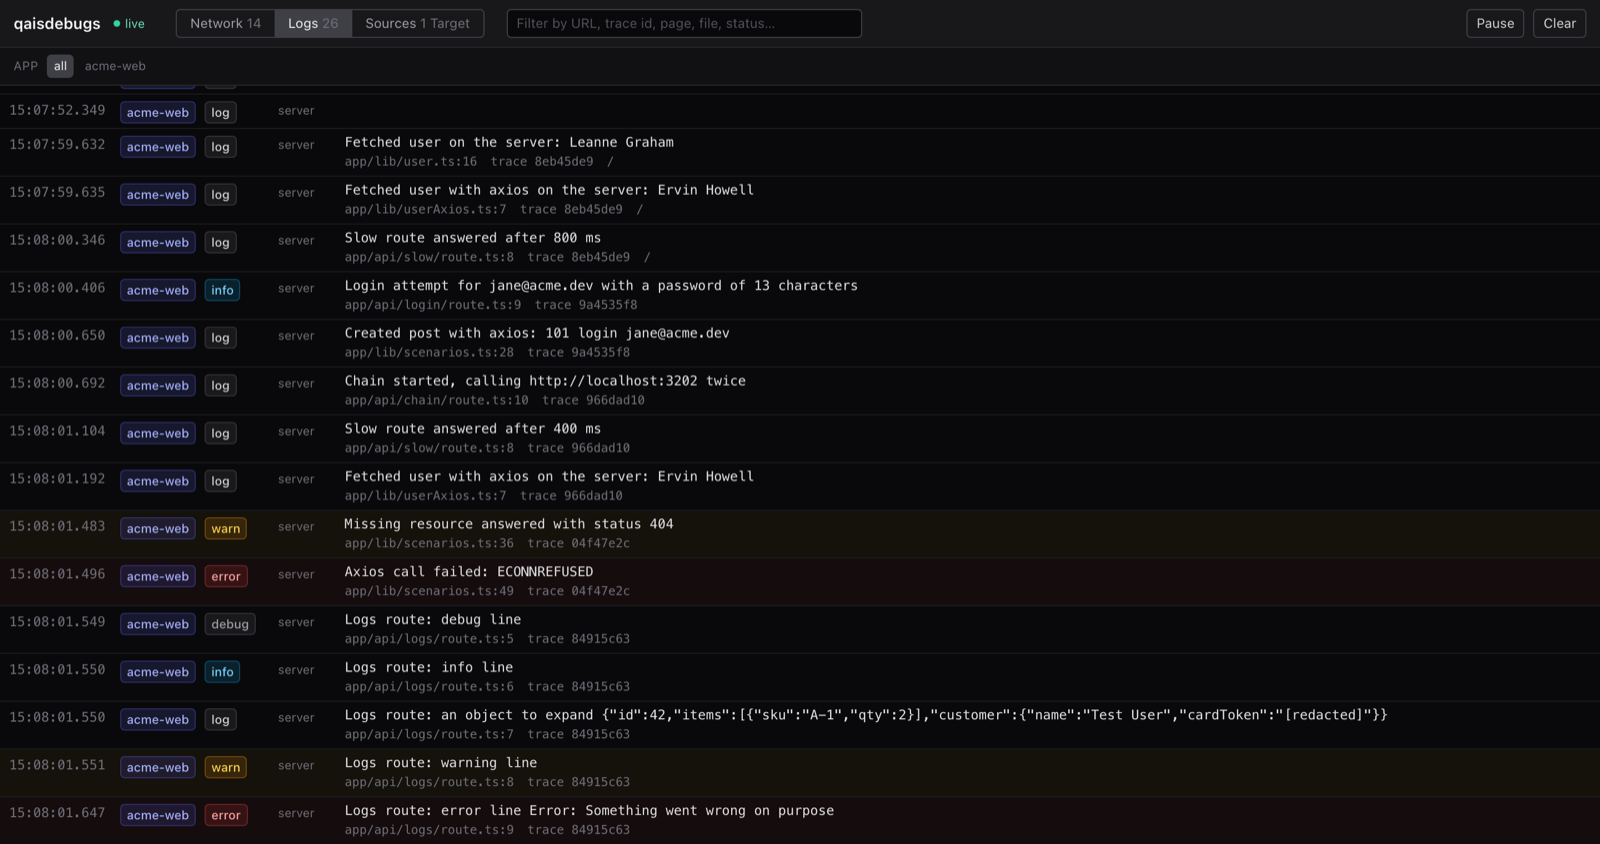
cardToken, masked automatically.Once, globally. Node 20.6 or newer.
npm install -g qaisdebugsFrom your Next.js app's folder. It runs your own dev script.
qaisdebugs devThen use your app as usual and watch everything arrive.
http://127.0.0.1:4983qaisdebugs includes an MCP server. Claude can read the requests, traces and logs, open your source files, and set breakpoints, wait for the pause and read the variables.
claude mcp add qaisdebugs -- qaisdebugs mcpapi.example.com/products?category=undefined from app/shop/page.tsx:18, and the API answered with an empty list.searchParams is a Promise in Next 15, so searchParams.category is undefined. It needs (await searchParams).category.How to debug Server Components, API routes, Server Actions, logs, network requests and hydration errors, with the built-in tools and with qaisdebugs.
Work out whether the failing code runs on the server or in the browser, then check its logs, its network calls and its variables. Browser DevTools cover client code; server code needs the terminal, fetch logging and the Node.js inspector. qaisdebugs shows both sides in one place. Read the full guide.
Browser DevTools and React DevTools for the page, the Node.js inspector or VS Code for server breakpoints, and qaisdebugs to see server and browser requests, logs and breakpoints together. See the tools compared.
Server Components, Route Handlers and Server Actions run inside the Next.js server, so their calls go straight from Node.js to the API and never pass through the browser. qaisdebugs records them where they happen and joins them with what the page did. More on server-side requests.
Setting logging: { fetches: { fullUrl: true } } in next.config lists fetch calls with URL, status and timing. qaisdebugs records every call, axios, got and node-fetch included, with headers, bodies and the file and line that made it.
Their console.log output goes to the terminal, and since Next.js 15 it is also replayed in the browser console. To pause them, start next dev with the Node.js inspector, or click a line in the qaisdebugs Sources view. Server Components guide.
Start the dev server with NODE_OPTIONS='--inspect' next dev and attach Chrome through chrome://inspect, or use a VS Code launch.json. With qaisdebugs, click a line number in its Sources view and it connects for you. VS Code and Chrome guide.
Use the browser's DevTools Sources panel and React Developer Tools. With qaisdebugs, qaisdebugs dev opens your app in a Chrome window of its own and connects to it, so a breakpoint you set in the inspector pauses there. Chrome does not allow tools to pause an everyday window.
Call the route directly with curl -i, log the incoming request, and pause inside the handler. Check the query parameter names and await params in Next.js 15 and later. API routes guide.
A Server Action is a POST to the current page with a Next-Action header. Its logs go to the terminal, and breakpoints work like any server code. Watch for redirect() inside try/catch and a missing revalidatePath. Server Actions guide.
Server code logs to the terminal running next dev; client code logs to the browser console. Client Components log in both during their first render. qaisdebugs shows server and browser logs in one list. Next.js logs guide.
Find what differs between the server and browser render, often dates, random values, browser-only checks or invalid HTML nesting, and render those values after mounting or only in the browser. Hydration errors guide.
No. qaisdebugs attaches to the dev server from outside with a Node preload. Your code, config and dependencies stay untouched.
Next.js 13.4 to 16 with the App Router, on webpack or Turbopack, with npm, pnpm, yarn or bun.
No. Everything stays on your machine. The inspector listens on 127.0.0.1 only, and passwords, tokens and cookies are masked before they are recorded.
It only runs inside next dev, and only when started through qaisdebugs. Production builds and next start are never touched, and recording happens off the request path.
Yes. qaisdebugs includes an MCP server: run claude mcp add qaisdebugs -- qaisdebugs mcp, or add the command qaisdebugs mcp in Cursor's MCP settings. The assistant can then read requests and logs and set breakpoints. MCP guide.
Yes. It is open source under the MIT license, on npm and GitHub.
npm install -g qaisdebugs